Business decisions depend on understanding the relationships between people, projects, assets, costs and commitments. This guide explains how a knowledge graph represents those relationships, brings operational information together and provides a foundation for Intelligent Decision Support Systems (IDSS).
A supplier delivers materials for a project. The project needs people with particular skills. Those people have existing commitments. A delayed delivery changes when they are needed and may affect costs, other projects and the delivery date.
Teams understand many of these connections, but the information often sits in different places. Procurement holds supplier records. Scheduling holds deadlines. HR holds skills. Finance holds rates.
Answering a question such as “What happens if this delivery is late?” can mean bringing several departments together to assemble the picture.
A knowledge graph gives those departments a connected model to work from.
A connected picture of your business
A knowledge graph represents things and the meaningful relationships between them. Those things might be people, projects, equipment, locations, documents or events. The relationships describe how they fit together.
Consider a building project:
- A concrete crew works on a slab pour.
- The slab pour belongs to a building project.
- The crew has the required concreting skills.
- The slab pour depends on an inspection sign-off.
Each connection adds context. A crew listed in a site schedule becomes more useful when you can connect it to the work it is assigned, the skills it brings and the approvals needed before that work can begin.
Entities, relationships and properties
A graph model has three building blocks: entities, the relationships between them and the properties that describe them.
Entities, represented as nodes, are the things in the model: a person, machine, project or supplier.
Relationships, sometimes called edges, connect those things: “assigned to,” “supplies,” “located at” or “depends on.”
Properties describe their details, such as a person's name, a task's planned finish date or a machine's operating status. Depending on the graph technology, relationships can also carry details, such as the dates of an assignment.
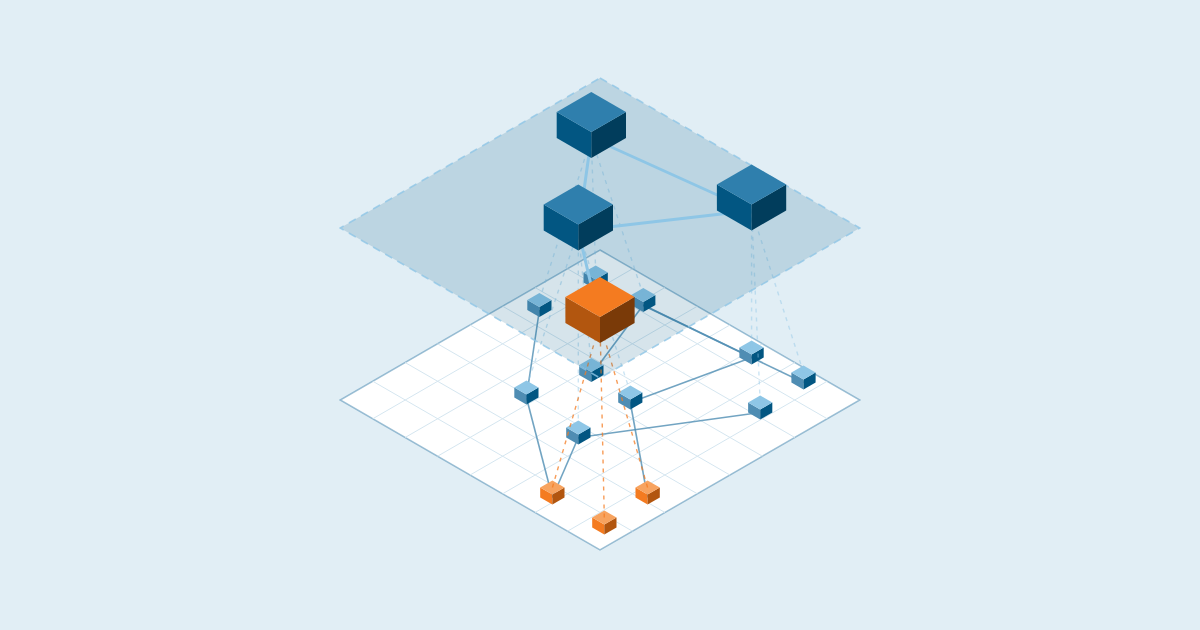
You do not need to learn these terms to use a knowledge graph. People can work with the connected information through schedules, dashboards, reports, searches and AI assistants. The network diagram is one way to illustrate the model underneath.
Following a change through the business
Imagine a manufacturer receives notice that a parts delivery will arrive three days late.
The purchasing record identifies the delayed parts. To understand the wider impact, planners also need to know which production orders require them, which resources are booked and which customer commitments could be affected.
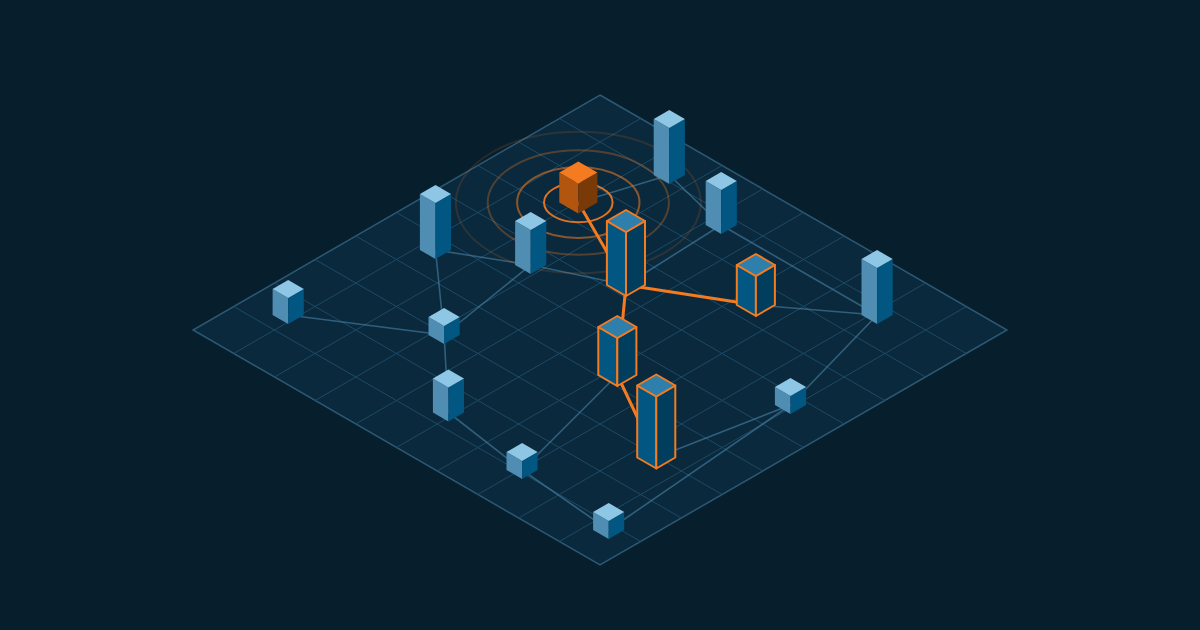
A knowledge graph connects those records so the team can follow the dependencies.
Planners can ask:
- Which orders depend on these parts?
- Is there enough time in the schedule to absorb the delay?
- Would moving an order create a machine or staffing conflict?
- Which customer commitments need attention?
Connected information can then feed planning tools that compare responses, such as changing the production sequence or using another supplier.
The graph provides the connected context. Planning rules, analytical models and human judgment determine how to respond.
Different industries, familiar questions
The things being connected change between industries. The need to understand their relationships is widely shared.
| Industry | Connected information | A practical business question |
|---|---|---|
| Building & Construction | Material deliveries, work packages, permits, crews and milestones | Which activities, crews and milestones need review if a material delivery slips? |
| Healthcare & Aged Care | Rosters, staff qualifications, care requirements, rooms and equipment readiness | Can tomorrow's planned roster meet care requirements while accounting for staff skills and facility readiness? |
| Banking & Finance | Borrowers, ownership structures, collateral, exposures and risk limits | Which apparently separate exposures are connected to the same underlying asset, and what would a change in its value affect? |
| Heavy Industry & Energy | Work orders, isolations, permits, spares, equipment and contractor assignments | Are the required parts, clearances, equipment and qualified personnel in place for a shutdown work package to start? |
| Manufacturing | Production orders, bills of materials, supplier deliveries, machines, tooling and operator skills | How would a delayed component affect the production sequence, shared resources and customer delivery commitments? |
| Media & Production | Artists, skills, tasks, bookings, shared resources and project budgets | Can the studio take on another production without overcommitting specialist staff or disrupting existing delivery commitments? |
These are illustrative examples. What a particular system can answer depends on the information, relationships and rules available to it.
How does the information get into the graph?
Information enters a knowledge graph through data ingestion: the process of collecting information from source systems, preparing it for use and mapping it into the graph's connected model.
For an enterprise, those sources may include ERP and project-management applications, HR and finance systems, operational databases, spreadsheets, documents and equipment telemetry. Ingestion brings relevant information from these sources into a common operational context while retaining its origin and timing where supported.
Model Context Protocol (MCP) provides another route for bringing information into the graph. An authorized AI assistant or agent can retrieve information through tools exposed by connected systems, then use JanusKS MCP tools to submit new records or update existing ones. For example, an agent could retrieve a supplier delivery update and submit the revised arrival date against the relevant delivery record. The available tools, assigned permissions and configured validation and approval rules determine what it can read or change. Learn more about MCP & Integration.
A practical ingestion process involves several stages:
- Extract and parse information. Connect through APIs, database interfaces, event streams, file imports or authorized MCP tool calls. Structured records can be read directly; documents may require text extraction and review before their contents can be mapped reliably.
- Validate and normalize records. Check required fields and reconcile differences in formats, units, dates and naming conventions. Missing or conflicting information should be identified for resolution.
- Resolve entity identities. Establish whether “Arden Engineering” in finance and “Arden Eng.” in a project tracker refer to the same supplier. Identifiers, matching rules and review of ambiguous cases help connect records without merging unrelated entities.
- Map information to the ontology. Translate source fields into shared business concepts, such as suppliers, work orders, assets and commitments. Establish the relationships supported by the source information and agreed mapping rules.
- Record provenance and time. Retain references to the source and relevant timestamps so users can assess where information came from, when it was captured and, where available, when it applies.
- Maintain the graph as sources change. Use event-driven updates, streaming, scheduled synchronization or MCP-enabled agent workflows according to the source system and operational requirements.
For example, a supplier delay notice may update a delivery record. Its existing relationships then identify the production orders that need review. Configured monitoring or planning processes can use that change to reassess dependencies and alert the relevant team.
Ingestion frequency matters: a graph updated nightly supports different decisions from one receiving frequent operational events. Access permissions, validation and exception handling also need to remain part of the process.
The JanusKS Data Ingestion capability provides the entry point for bringing operational systems, documents and feeds into an enterprise knowledge graph.
Where does an ontology fit?
A knowledge graph needs consistent meaning.
Does “available” mean someone has no booking, or that they also have the required skills and are not on leave? Does “ready” mean a part has arrived, or that it has also passed inspection?
An ontology defines the kinds of things in the model, what they mean and how they can relate. Read our companion whitepaper, What is an ontology?, for a closer look.
For a creative studio, that might include artists, departments, projects, tasks, bookings and skills. For a manufacturer, it might include orders, machines, tooling, materials and work centers.
The ontology describes the structure and meaning. The knowledge graph connects the actual records using that model.
An industry-specific ontology helps ensure that the connected model reflects the terminology and operational relationships relevant to the business.
Adding time: learning from the history of the business
A business changes continuously. People move between projects, schedules are revised, supplier performance varies and costs evolve. Understanding today's position often requires knowing how it developed.
JanusKS knowledge graphs include temporality, allowing teams to review retained historical states and examine how entities, relationships and recorded values changed over time. This adds a historical dimension to the connected model.
For example, a construction team could compare the original plan, a revised schedule and recorded progress at earlier points in a project. By reviewing crew assignments, material deliveries, approvals and costs together, it can investigate when performance began to diverge from the plan and which changes accompanied that divergence.
Across multiple projects, historical analysis can help answer questions such as:
- How have actual task durations compared with estimates?
- Which suppliers have repeatedly delivered later than planned?
- When have staffing pressures coincided with higher overtime costs or delivery delays?
- How have costs, resource availability and project margins changed over time?
- What information was recorded and available when an earlier decision was made?
These comparisons help teams identify trends, test planning assumptions and learn from previous outcomes. A manufacturer might use recorded changeover durations to improve future production estimates. A creative studio might compare bid hours with actual effort across completed projects to refine its next proposal.
Historical patterns provide evidence for forecasting and scenario planning, while remaining subject to changes in operating conditions. A recurring association can guide investigation; it does not, on its own, establish a cause or guarantee a future result.
The available historical view depends on the information captured, integration coverage and retention settings. Learn more about JanusKS Insights & Temporality.
What are the business benefits?
Less time assembling the picture
Teams can follow connected records rather than repeatedly reconcile spreadsheets or ask several departments for context.
Earlier visibility of dependencies
A missing approval, expiring qualification or delayed delivery can be reviewed against the work that depends on it.
A stronger basis for planning
Connected information helps teams assess how proposed changes could affect people, resources, costs and commitments. It also provides context for scenario planning.
Learning from historical performance
Temporal records let teams compare earlier plans with recorded outcomes, identify recurring patterns and use that evidence to refine estimates, resource plans and operating assumptions.
Context for AI-assisted work
A knowledge graph can provide an AI assistant with relevant business records and relationships when answering a question or investigating an issue. Permissions still need to control access, and conclusions still need appropriate review.
What makes a knowledge graph useful?
A useful graph reflects the operation closely enough to support the questions people need to answer.
That requires accurate records, meaningful relationships, clear definitions and appropriate access controls. Connecting outdated information does not make it current. Missing relationships can leave gaps in an analysis, and a recorded dependency does not, by itself, prove what caused an outcome.
It is also possible to connect and analyze data in relational databases. A knowledge graph makes the entities and relationships an explicit part of the model; the right approach depends on the problem being solved.
Start with a practical question, then identify the information and connections needed to answer it. You do not have to model the whole business at once.
How JanusKS uses knowledge graphs
At JanusKS, knowledge graphs are a foundation of our Intelligent Decision Support System (IDSS) platform.
Projectal applies that foundation to media and entertainment, connecting people, projects, bookings, resources and financial information to support everyday planning and management.
The same approach can be shaped around other industries: define the things that matter, connect relevant information and preserve their history through temporality. Teams can then review past performance, understand the current position and compare future scenarios using a shared operational model. Historical analysis, scenario planning and AI-assisted recommendations build on that foundation.
A knowledge graph helps turn a collection of business records into a connected understanding of the operation. Its value lies in the questions your team can answer and the decisions that understanding helps them make.
Build a knowledge graph for your business
Contact JanusKS to discuss building a knowledge graph and Intelligent Decision Support System for your business. We can work with your team to identify the operational decisions that matter, define an industry-specific ontology, connect the relevant information and develop planning, analysis and AI-assisted capabilities around your requirements.